Scientific imaging
Scientific imaging resources
Find the organisations and documentation behind research imaging, image-analysis software and data standards.
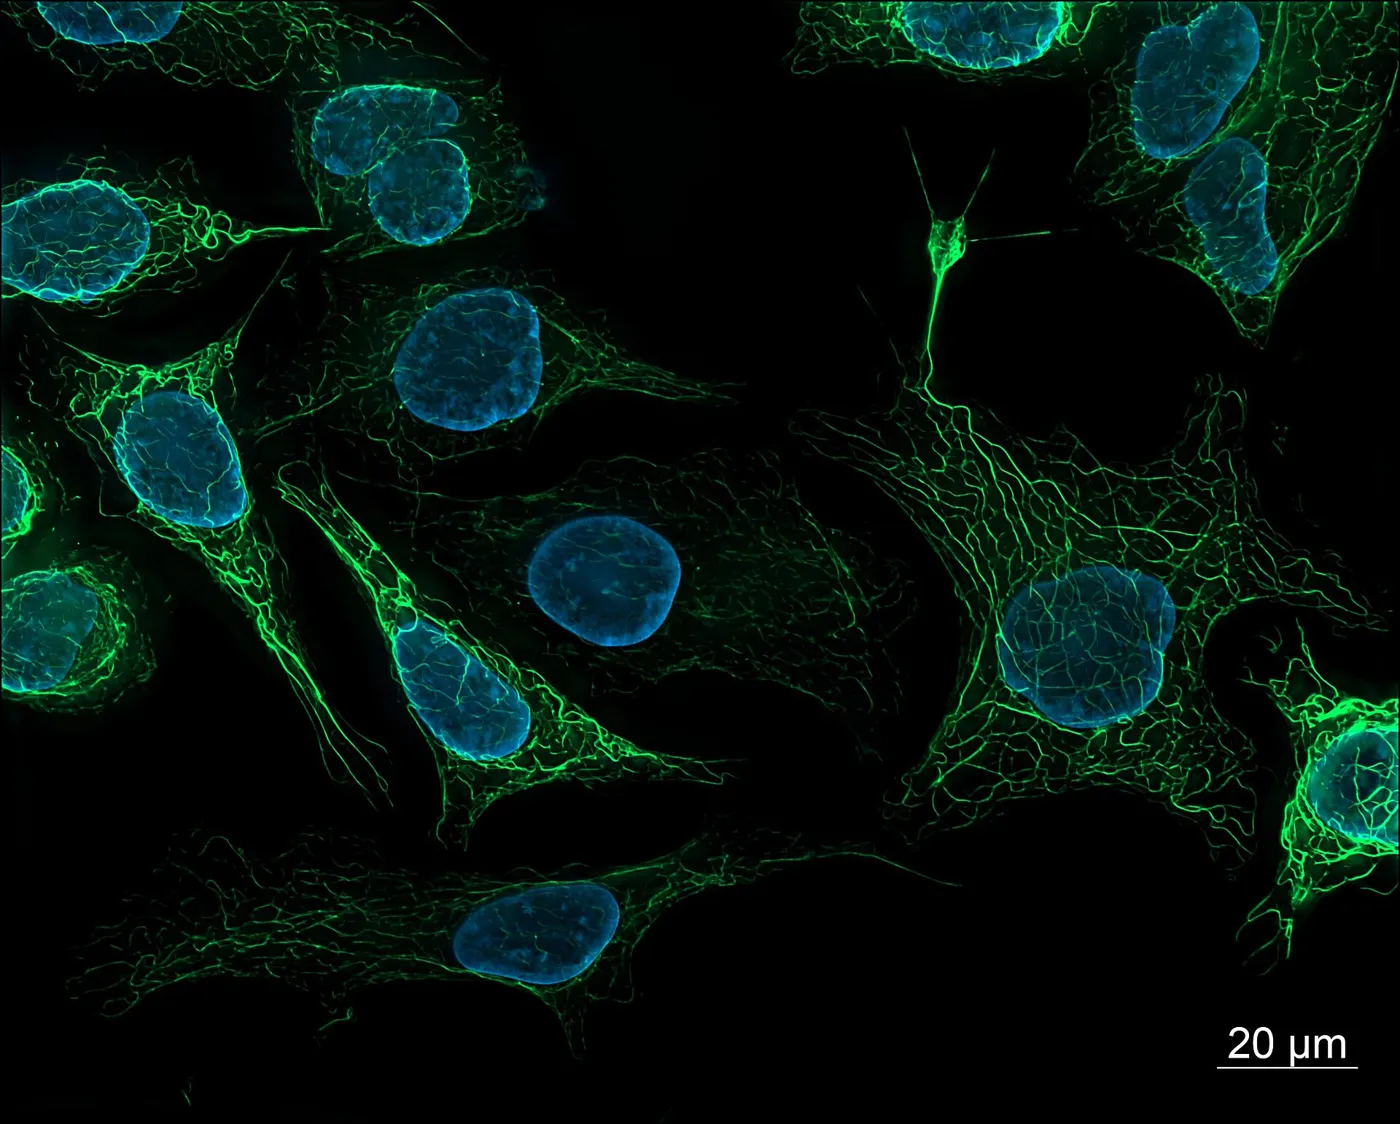
Photo: ZEISS Microscopy from Germany, Wikimedia Commons, CC BY 2.0.

A research image is a measurement, not a snapshot. This page points you to 3 kinds of resource: software to analyse images, standards to organise data, and dated records of older research tools.
 Analyse images
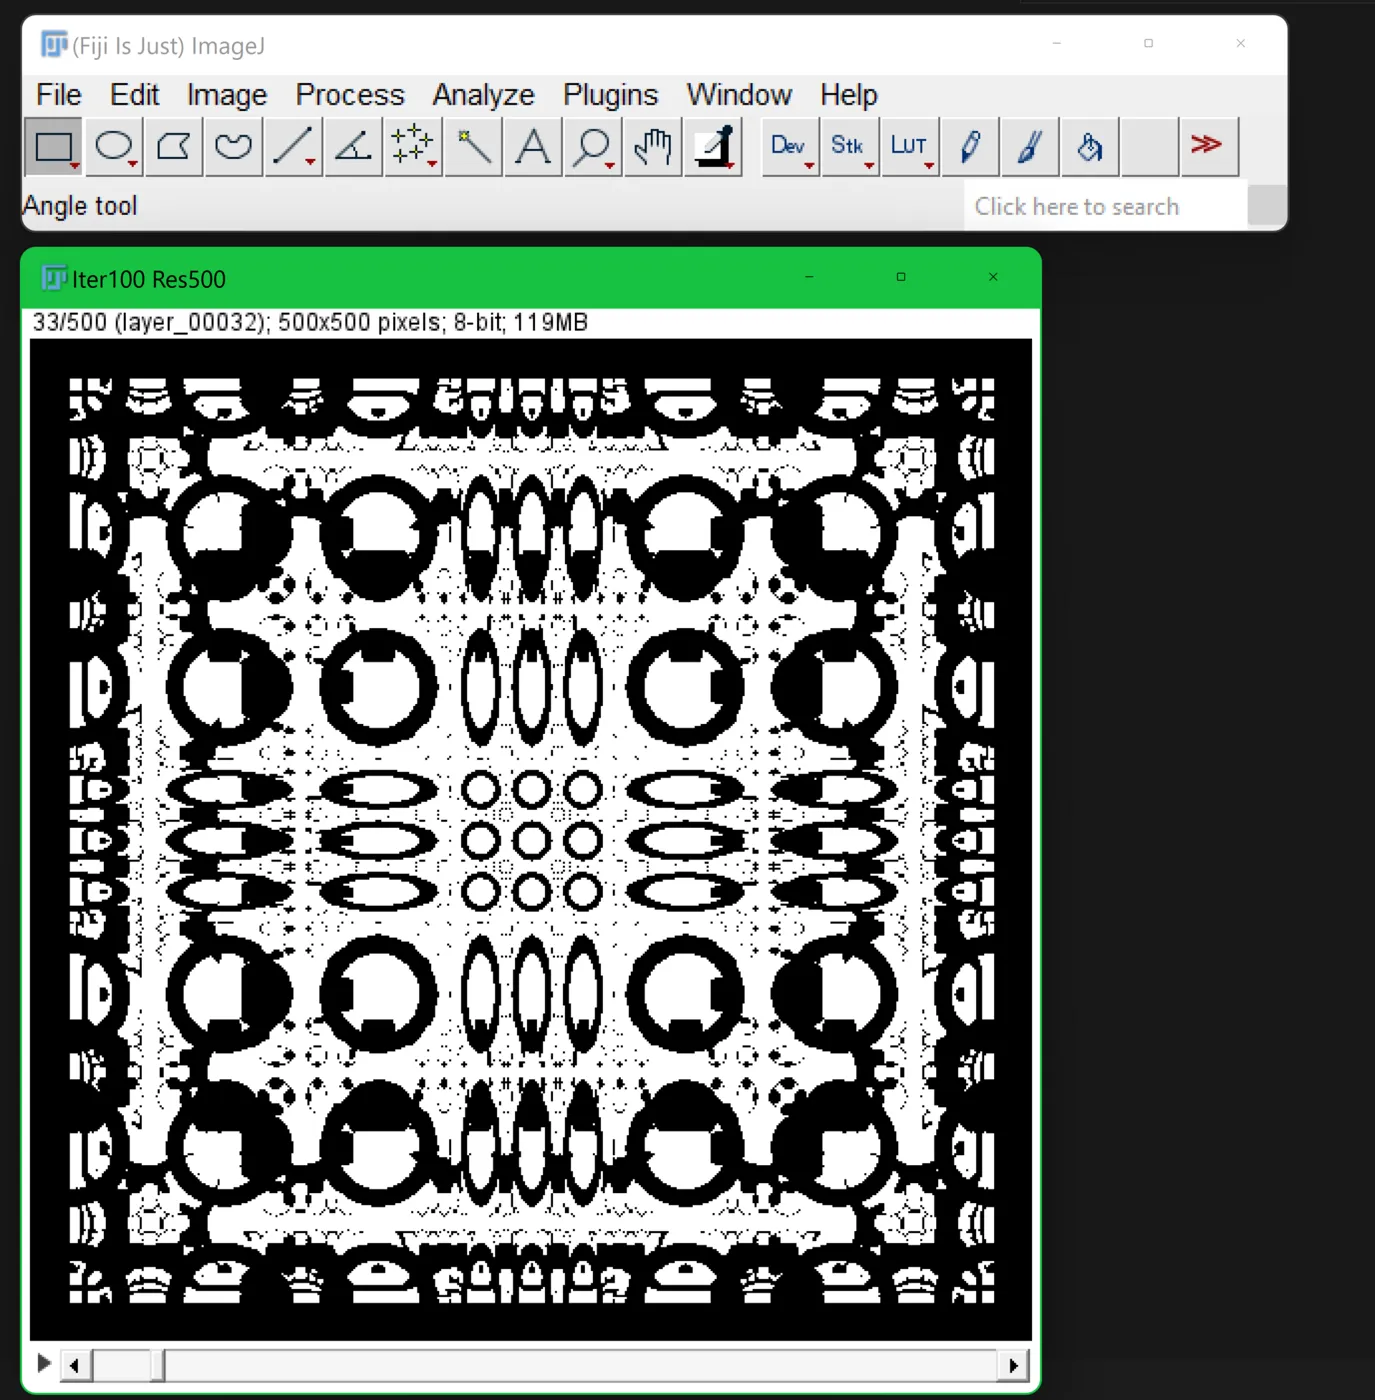
Photo: Fiji developers (Johannes Schindelin, Ignacio Arganda-Carreras and others), Wikimedia Commons, CC0.

 Brain scans
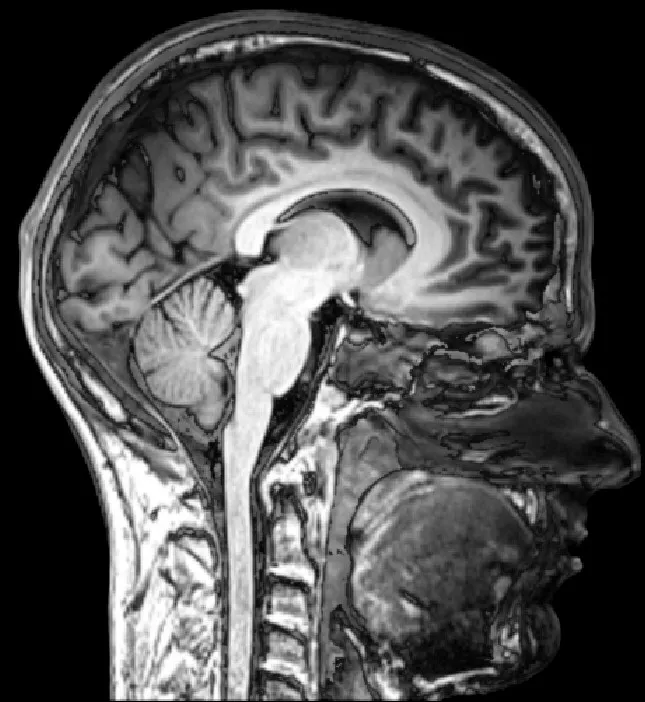
Photo: everyone's idle, Wikimedia Commons, CC BY-SA 2.0.

 Microscopy
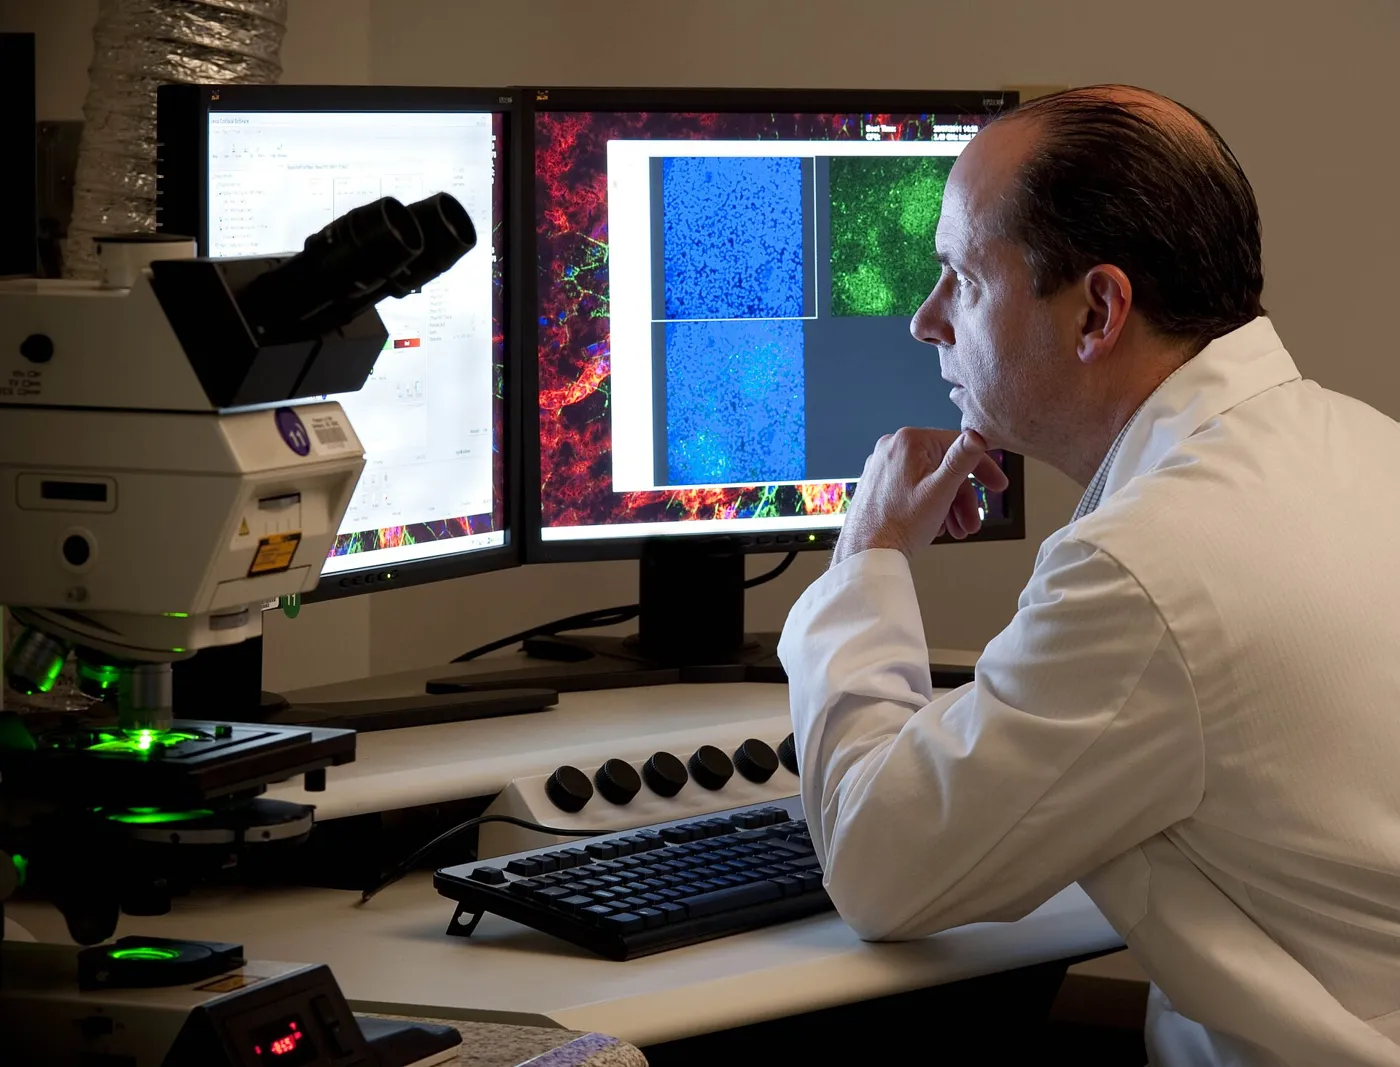
Photo: National Eye Institute, Wikimedia Commons, CC BY 2.0.

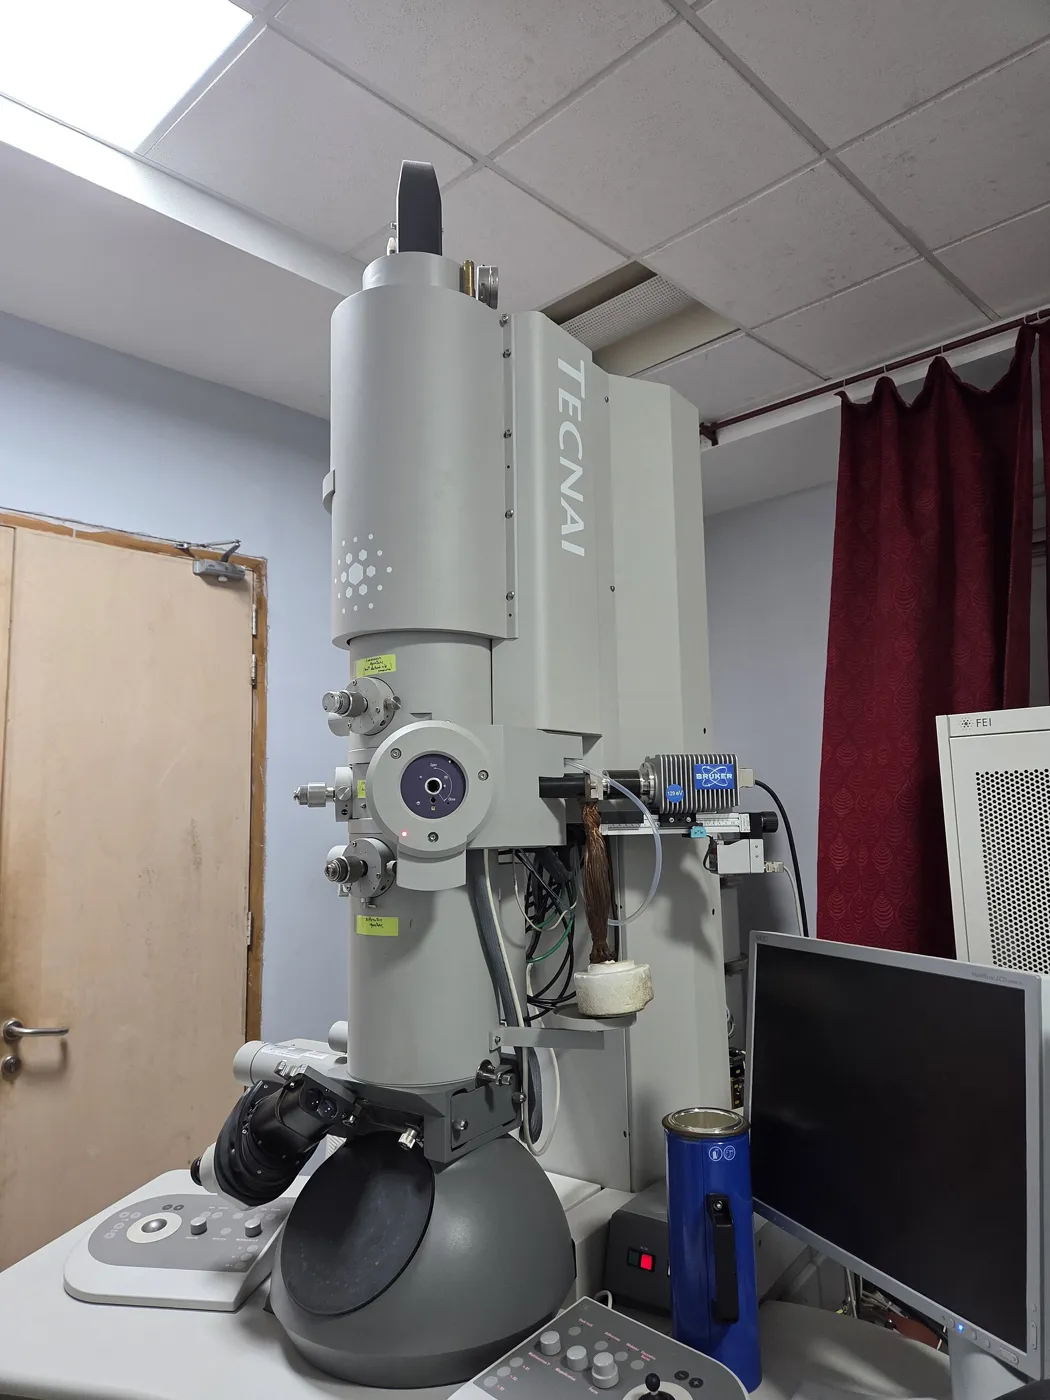 Electron microscopes
Photo: Gannu03, Wikimedia Commons, CC BY-SA 4.0.

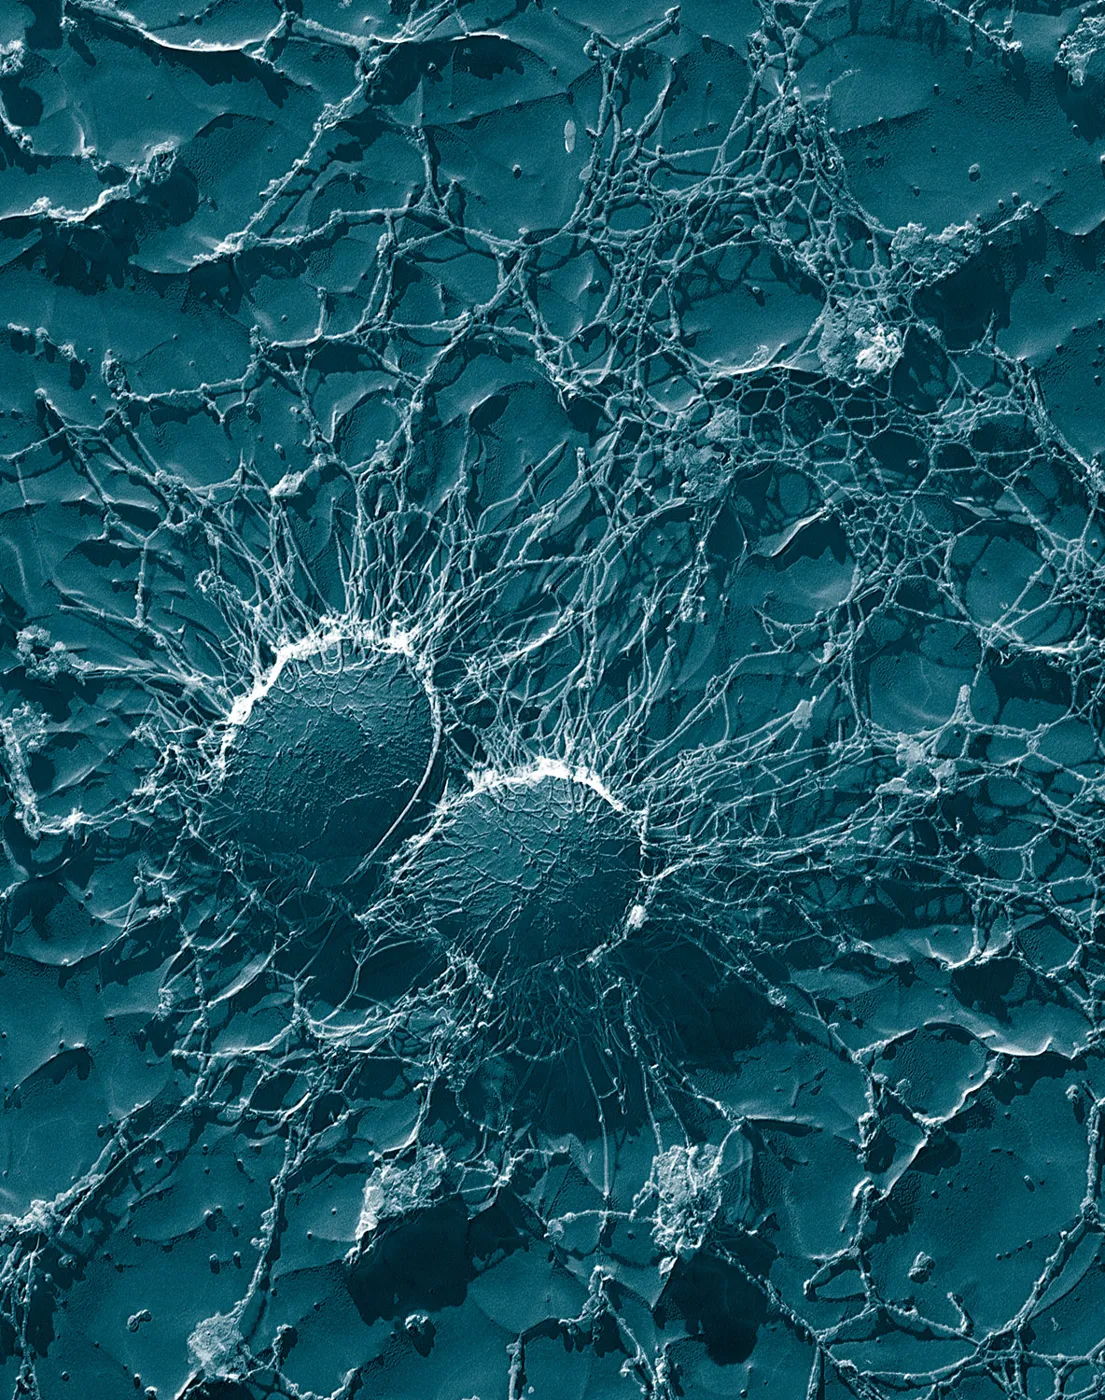 Bacteria at 50,000x
Photo: Eric Erbe, Christopher Pooley, Wikimedia Commons, Public domain.

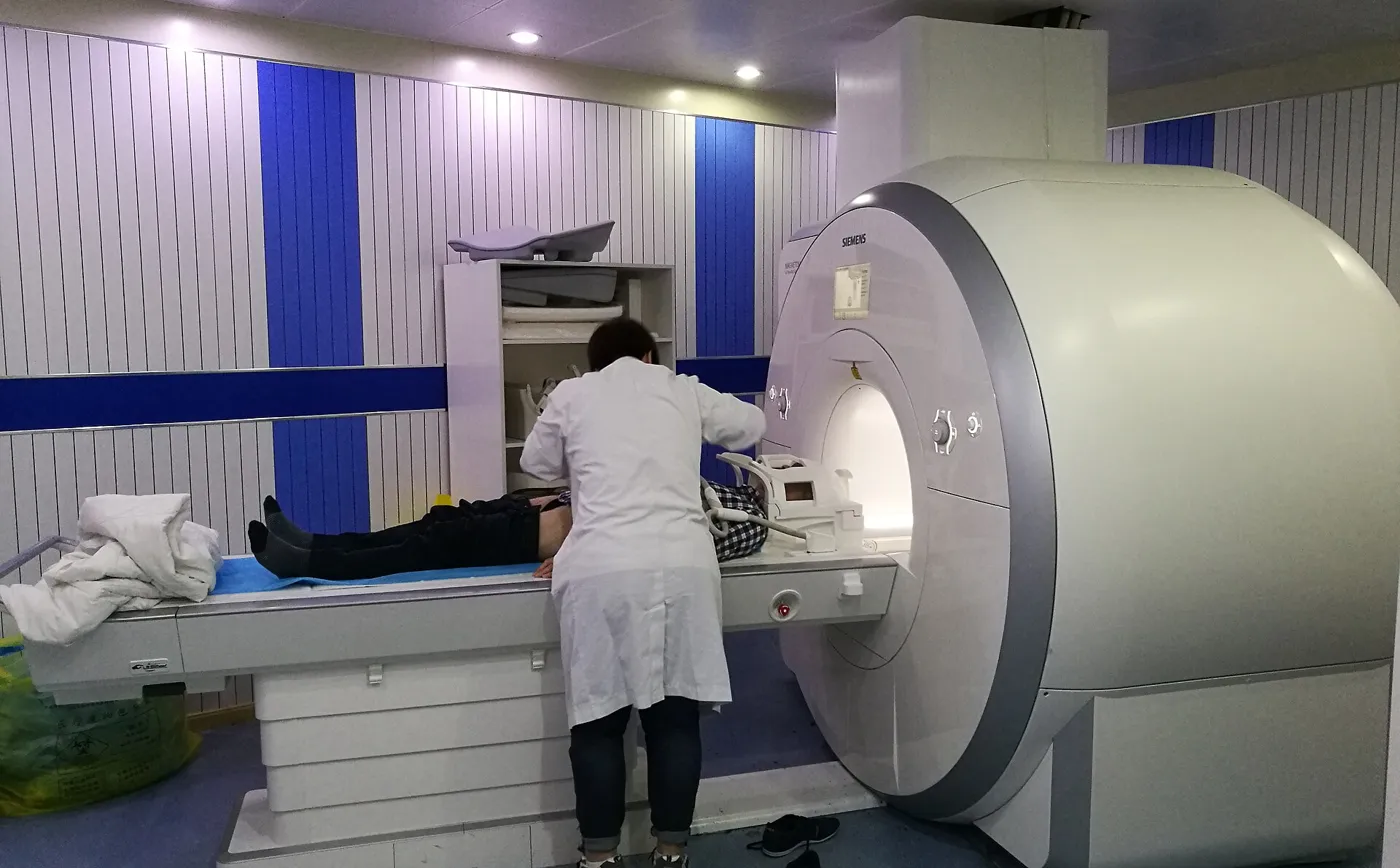 MRI scanners
Photo: Ptrump16, Wikimedia Commons, CC BY-SA 4.0.

1. Software to analyse images
Fiji is a free bundle of ImageJ2 with many plugins ready to use. Its makers call it a "batteries-included" package for scientific image analysis.
ImageJ itself is old and well tested. It has been in continuous development since 1997. A redesign called ImageJ2 began in 2010, and Fiji is built on it.
Use Fiji to measure, count or outline objects in microscope images. Check each plugin's own notes and licence before you rely on it for published work.
2. Standards to organise brain data
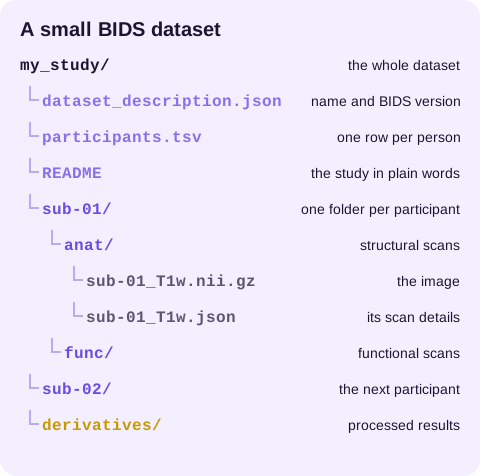
The Brain Imaging Data Structure, or BIDS, is a shared way to name and sort brain-imaging files. It began at a working group meeting at Stanford in January 2015.
BIDS uses plain folders plus small text files in JSON and TSV formats. It started with MRI and now also covers MEG, EEG and intracranial EEG.
3. Records of older research tools
The Characterisation Virtual Laboratory notes link dated Monash records. They keep that history apart from how access works today. Imaging Tools does not run that service or give out accounts.
What happens next
Got brain scans to share? The BIDS guide walks through the folder layout and file names, one step at a time.
Read the BIDS guideQuick comparison: which resource fits your task?
| You need to | Start with |
|---|---|
| Measure, count or outline objects in microscope images | Scientific image analysis tools |
| Learn image analysis from step 1 | Image analysis training |
| Sort MRI, EEG or MEG data for sharing | BIDS guide |
| Read older Australian research desktop records | CVL notes |
| Follow electron microscopy processing notes | EM portal notes |
Why research images need different tools
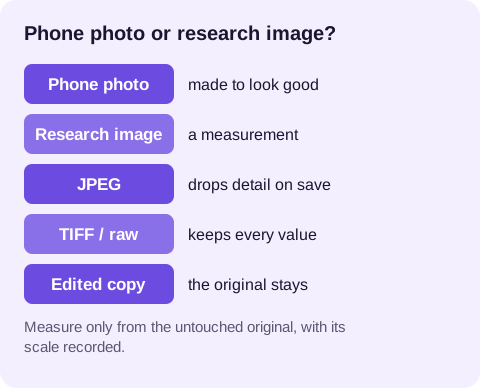
Each pixel in a research image records how much light, signal or density the machine picked up. Change that value and you change the data.
Research software keeps those values intact. It records the scale, such as how many microns 1 pixel covers. It also repeats the same steps on every image, so 100 images get the same treatment as 1.
That is why research images are often saved as TIFF or in the machine's own format, not as JPEG. JPEG throws detail away each time it saves.
5 good habits for any research image
- Keep the untouched original and work on copies.
- Write down the machine, its settings and the date with each dataset.
- Use the same capture and display settings for images you plan to compare.
- Save your steps as a macro or script so you can run them again.
- Store data where your institution's data plan says, above all when it involves people.
3 questions before you start
What did the machine record?
A light microscope, an MRI scanner and an electron microscope each save different kinds of data. Find the tool built for yours.
Who needs to read it next?
If a lab partner, a journal or a public archive will use your files, follow the standard they expect from day 1.
Can you repeat it?
Write your steps so someone else could follow them. If you cannot run the same steps twice and get the same answer, fix that before you share results.
Who looks after these tools
ImageJ began at the US National Institutes of Health. It is public domain software, and members of its community have written hundreds of plugins for it. A group of developers packages Fiji with its plugins.
BIDS is a community standard with open rules. Its specification is written in public on GitHub, where anyone can read the talks, report a problem or suggest a change.
These links are pointers only. Imaging Tools is not part of any of these groups.
What happens next
Need to pick software for your images? The tools guide compares the main free options and what each one suits.
See the analysis tools