Scientific imaging
Scientific image analysis: ImageJ, Fiji and when to move on
A starting point for research image analysis, with current project documentation and clear limits on this restored resource.
For research image analysis, start with the format of your data and the measurement you need. ImageJ and Fiji are documented tools to investigate; Fiji is an ImageJ distribution with community plugins. A phone-photo editor is a different product category and is not a substitute for a reproducible measurement workflow.
This restored Imaging Tools resource links to the actual projects. Imaging Tools does not operate ImageJ, Fiji or the historical Australian research infrastructure linked from this section. It does not claim to be a university service or a medical image interpretation provider.
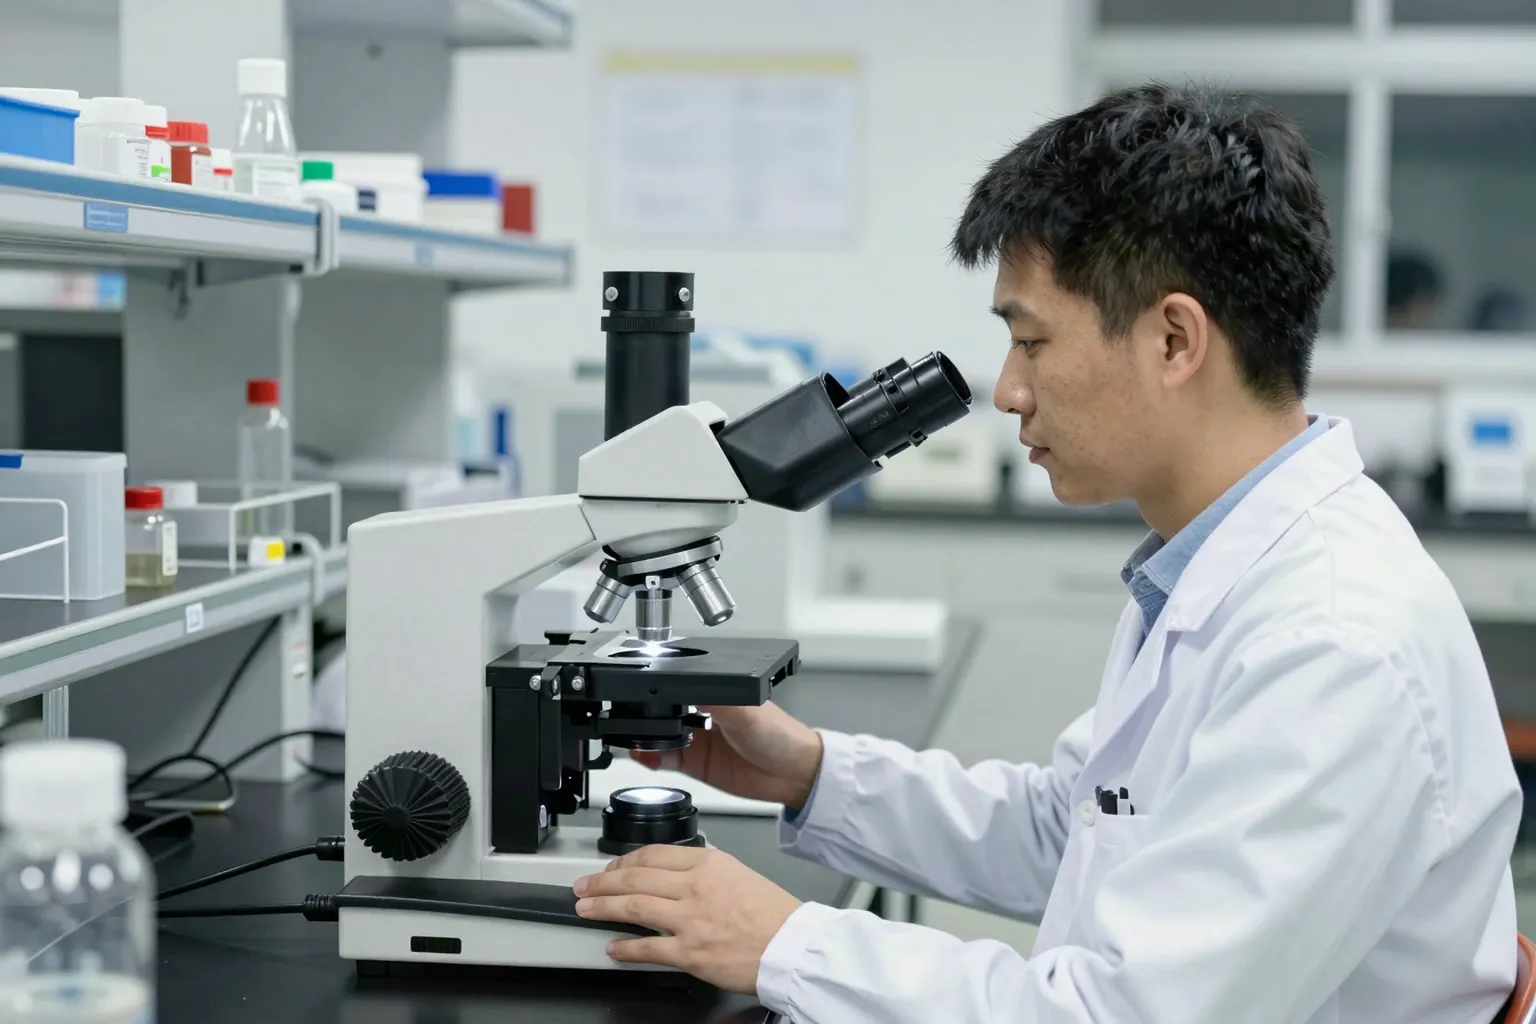
Choose a workflow before a plugin
Record the file format, bit depth, channels and spatial calibration of the original. Work on a copy and keep the original acquisition metadata. Decide whether the task is viewing, segmentation, counting or another measurement before looking for a convenient button.
ImageJ’s introductory documentation explains its main window, image types and calibration. If physical scale is missing from a file, entering a value is a separate step; it is not evidence that the software knows the correct measurement automatically.
Fiji: use the actual download guidance
Fiji’s current download page distinguishes the recommended Latest build from Stable for older systems and plugin compatibility. Use that page for the supported operating system and architecture rather than an old third-party installer link. Record the version and relevant plugin versions used for an analysis you need to reproduce.
A small validation exercise
Before processing a large collection, choose a sample with a known or manually checked result. Write down the intended operation and compare the output with that reference. Keep the parameters, not only an image of the final screen. A repeatable operation is not by itself proof that the operation answers your research question.
The basic ImageJ and Fiji workflow
Most scientific image analysis in ImageJ or Fiji follows the same five steps, whatever the instrument.
- Open the original with its metadata. Microscope and scanner files often carry pixel size, channel names and time stamps. Fiji includes the Bio-Formats importer from the Open Microscopy Environment, which reads many proprietary microscope formats with that metadata intact. Opening a JPEG export instead throws away bit depth and calibration.
- Check the image type. Under Image > Type, ImageJ shows whether a file is 8-bit, 16-bit, 32-bit or RGB colour. A 16-bit fluorescence image holds 65,536 intensity levels; converting it to 8-bit keeps only 256. Convert only when you know why.
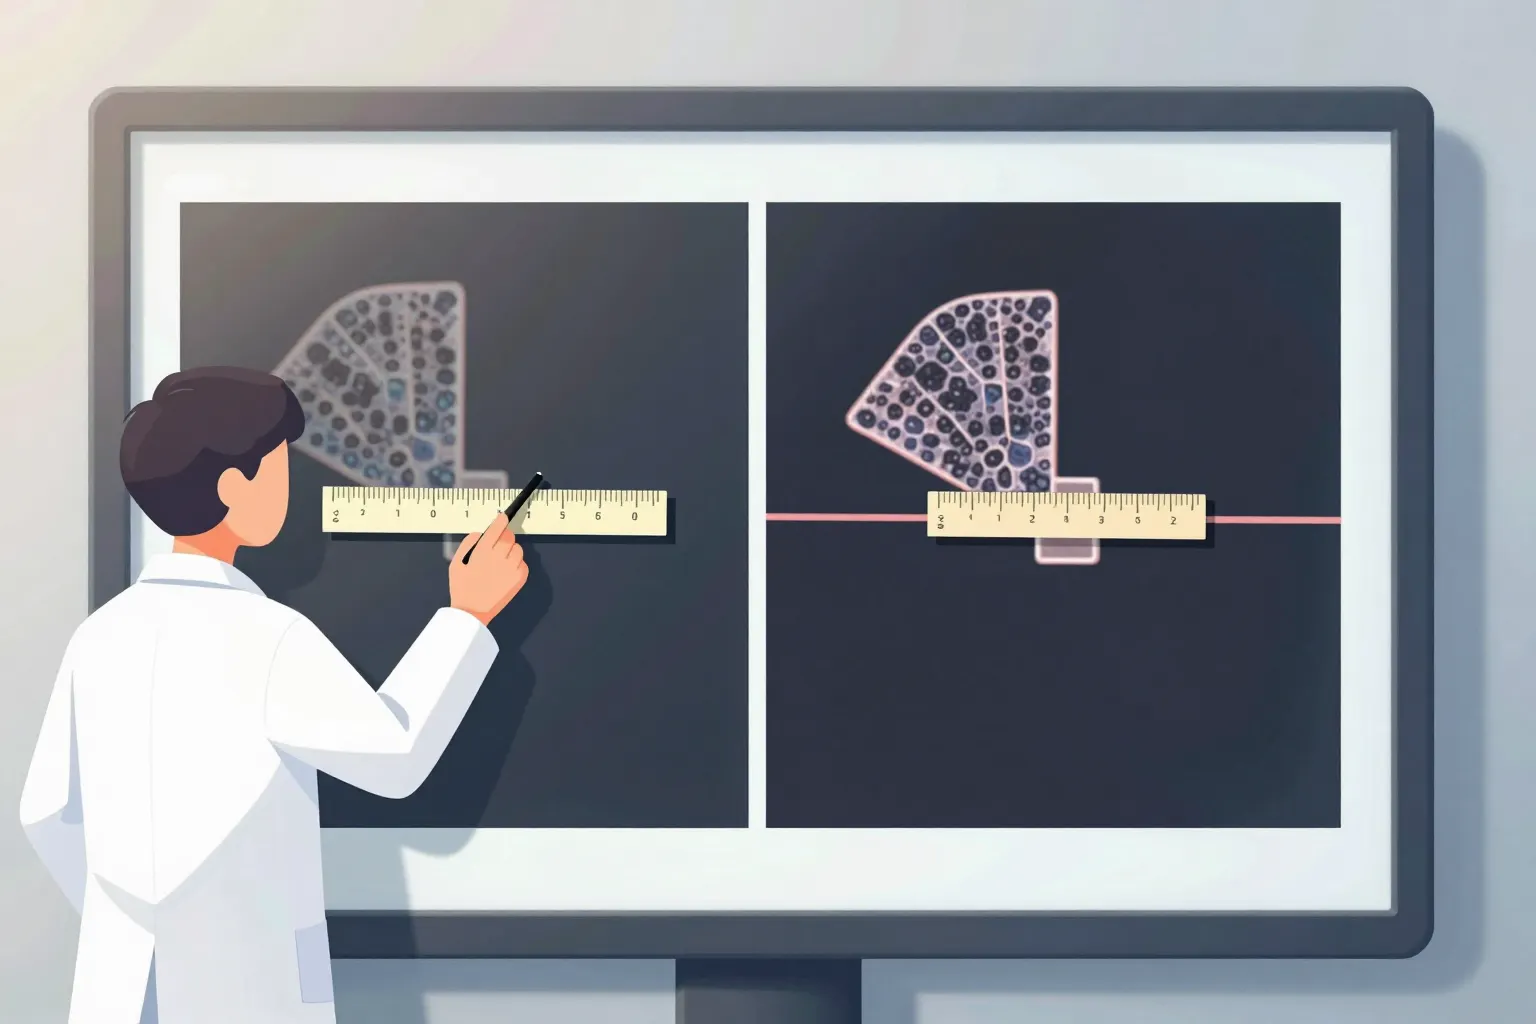
- Set or confirm the scale. Analyze > Set Scale links pixels to a physical unit. If the file already carries calibration, confirm it matches the instrument record. If it does not, measure a scale bar or stage micrometer and enter the value, and record where the number came from.
- Segment the objects. Thresholding (Image > Adjust > Threshold) separates objects from background by intensity. Analyze Particles then counts and measures each object. Choose measurements first under Analyze > Set Measurements, so the results table holds the values you need, such as area, mean intensity or shape descriptors.
- Save the results and the steps. Export the results table, save regions of interest from the ROI Manager and keep a record of every setting used.
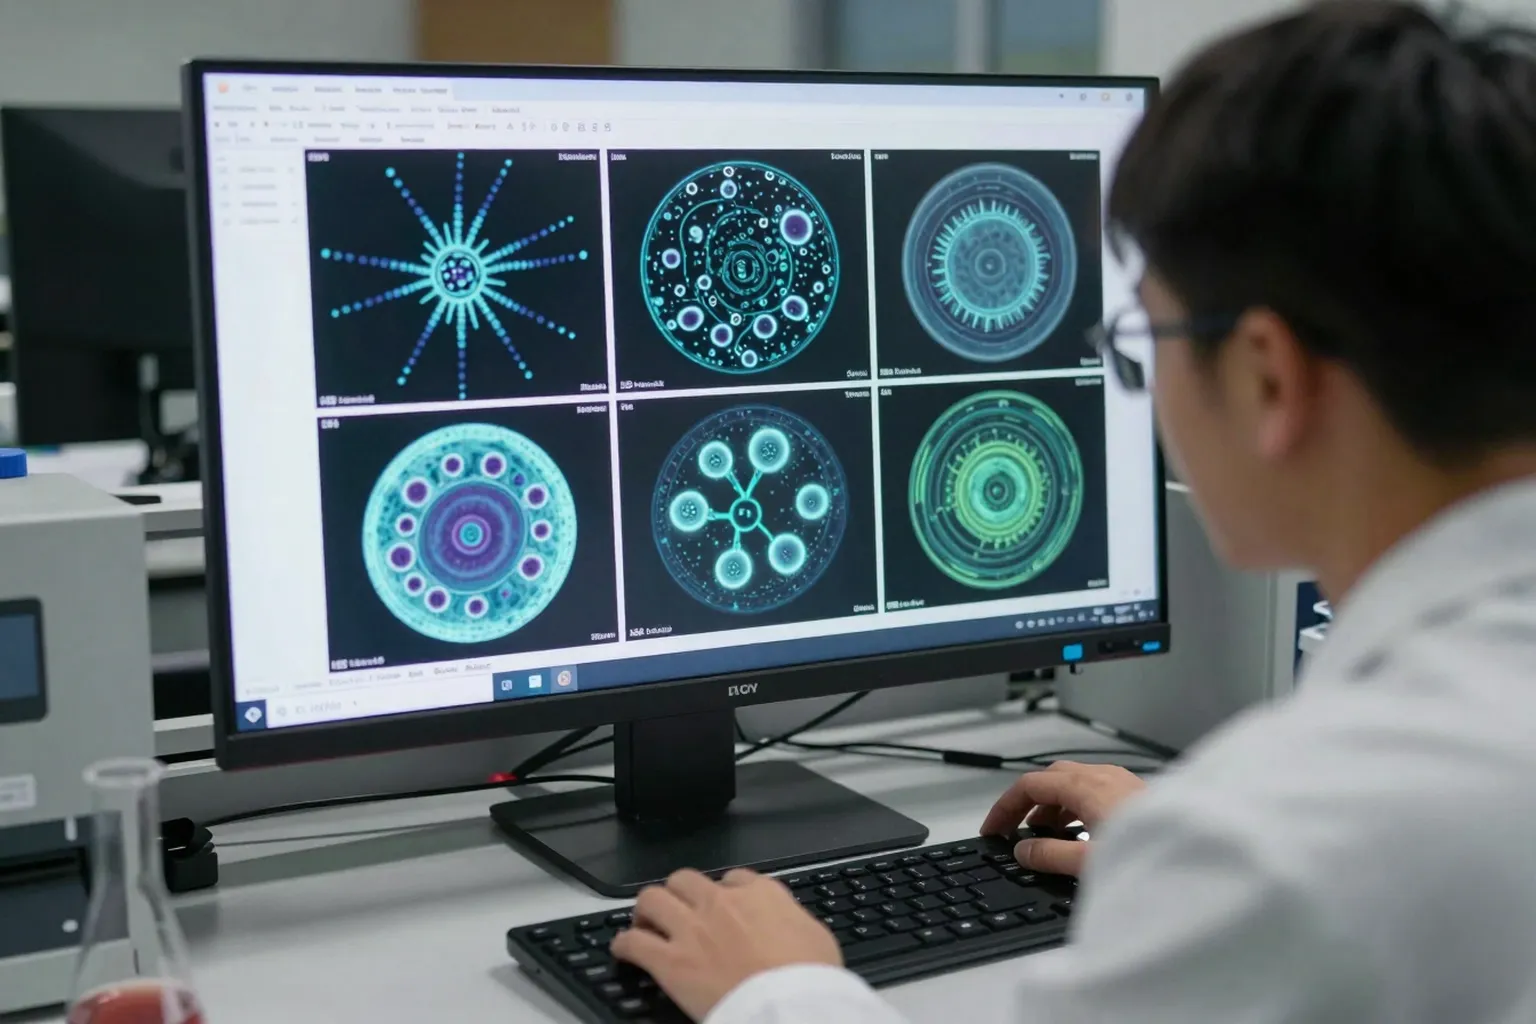
Display changes versus data changes
A frequent mistake in scientific image analysis is changing data while thinking only the display changed. In ImageJ, adjusting brightness and contrast alters how the image is shown on screen. Pressing Apply in that dialog rewrites the pixel values. Measure intensities on unaltered data, and make any display adjustment identical across images you plan to compare.
Saving as JPEG is the second common mistake. JPEG compression changes pixel values to save space, which corrupts intensity measurements and adds artefacts around edges. Keep originals and analysed copies in TIFF or the instrument's own format.
Batch processing with macros
When the same steps apply to many images, record them once. Plugins > Macros > Record writes each command you use as a line of the ImageJ macro language. Edit the recording into a script, then run it over a folder of images. A macro is also the best record of what was done: share it with the results so someone else can repeat the analysis exactly.
Test any macro on a small sample with a known answer first, and check a few outputs by eye after every batch. A macro repeats a mistake as reliably as it repeats a correct step.
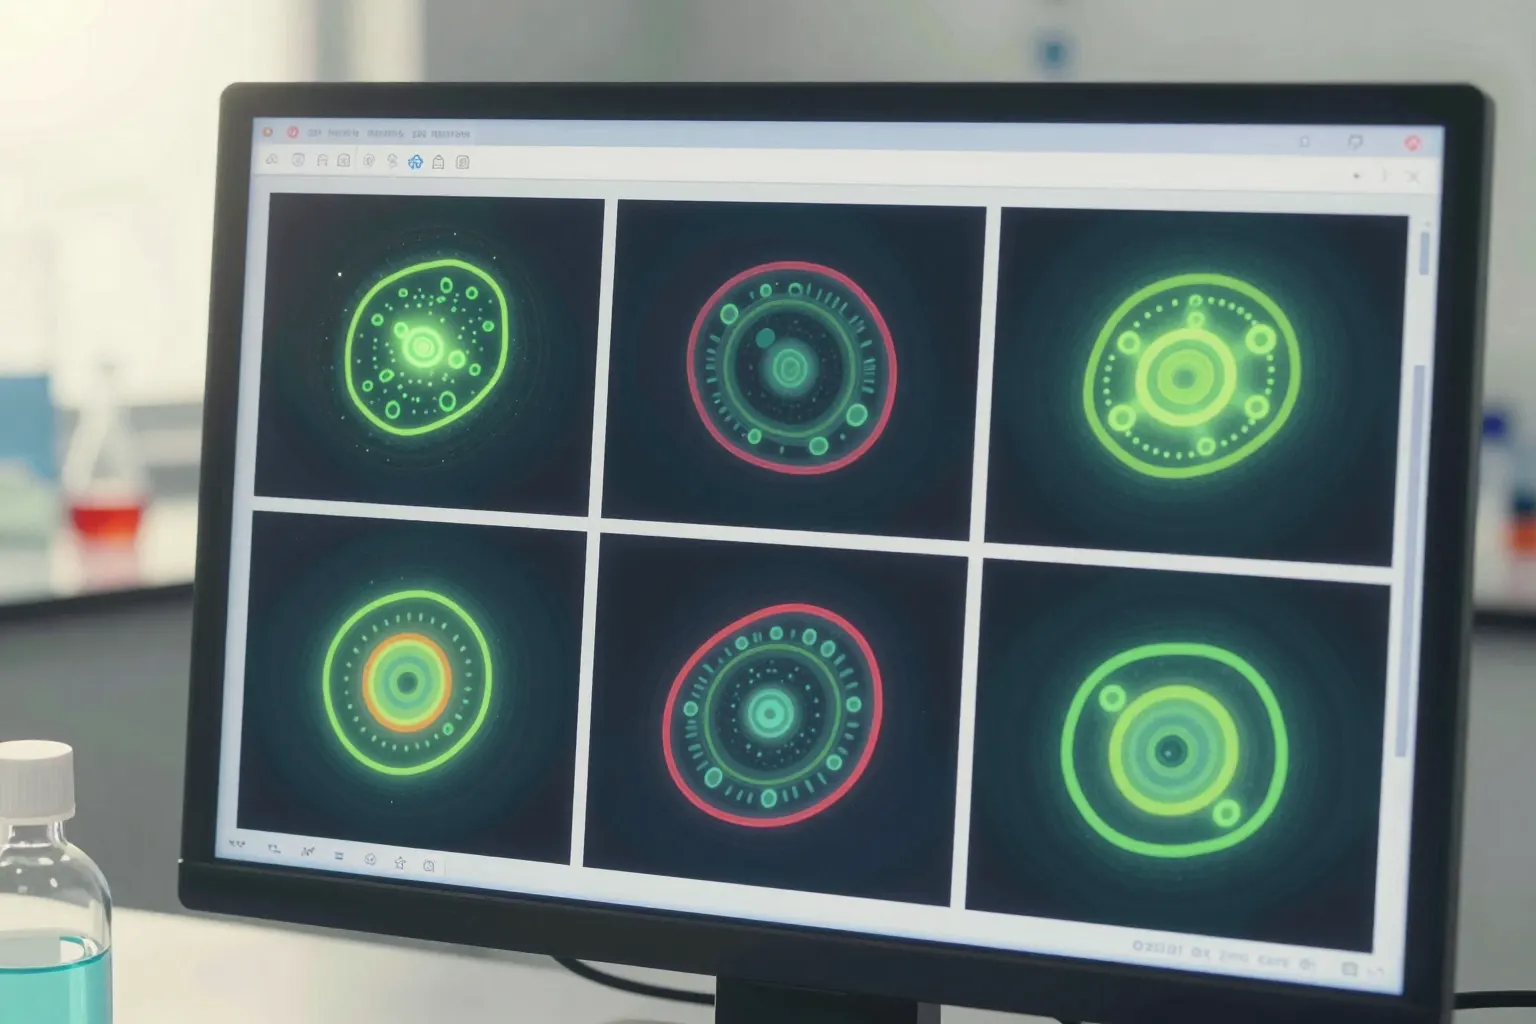
Multi-channel, stacks and time series
Microscope data is often more than a flat picture. A fluorescence image may hold three or four channels, each recording a different stain. A confocal or light-sheet dataset adds a stack of slices through depth, and live imaging adds time points. ImageJ calls a file with all of these a hyperstack.
Treat each dimension deliberately. Measure each channel separately rather than on a merged colour view, because the merge is a display. For a z-stack, decide whether to measure each slice, a maximum-intensity projection (Image > Stacks > Z Project) or a 3D object. A projection is useful for counting but flattens depth, so two cells on top of each other can look like one.
For time series, keep the frame interval with the data. Tracking tools in Fiji, such as TrackMate, need the correct interval to report speeds in real units.
Reporting your analysis
Journals and reviewers increasingly ask for enough detail to repeat an image analysis. A good methods paragraph names the software and version, the plugins used, every processing step in order with its parameters, how thresholds were chosen, and how many images and objects were measured. Attaching the macro or script is the simplest way to meet that standard. If any image shown in a figure had its display adjusted, say so and apply the same adjustment to every panel being compared.
Checking your own results
Before trusting a full analysis, pick five images and check the output by eye. Draw the outlines the software found over the original image and look for merged objects, missed faint objects and background counted as signal. If more than a few objects are wrong, adjust the method before measuring the rest, and keep the check images with your records. A short note on what you changed and why saves hours when a reviewer asks later.
When another tool fits better
ImageJ and Fiji cover a huge range of tasks, but some jobs have better-suited free tools.
| Task | Tool to consider | Why |
|---|---|---|
| Whole-slide pathology images | QuPath | Built for very large slide scans, cell detection and annotation across a slide |
| High-throughput batch measurement | CellProfiler | Point-and-click pipelines that run the same analysis over thousands of images |
| Python-based analysis and 3D viewing | napari | A multi-dimensional viewer that works with the Python scientific stack |
| Segmentation by example | ilastik | Trains a pixel classifier from a few strokes you paint on the image |
Deep-learning segmentation models such as Cellpose and StarDist can separate touching cells far better than a simple threshold, and both have Fiji or napari integrations. Treat their output as a result to validate against hand-checked examples, not as ground truth.
Common questions about scientific image analysis
Is ImageJ the same as Fiji?
Fiji is ImageJ with a large set of plugins, updaters and scripting languages already bundled. The core program and its measurements are the same, so a macro written for ImageJ usually runs in Fiji. Most labs start with Fiji because it saves hunting for plugins one at a time, and its built-in updater keeps them in step with each other.
Which file format should I analyse?
Open the file your instrument saved, such as a vendor format read through Bio-Formats, or an uncompressed TIFF exported from it. Avoid JPEG for measurement, because it throws away detail each time it is saved and can shift intensity values. Keep the untouched original in one folder and do all your work on copies in another, so you can always go back.
How do I set the scale on an image?
Read the pixel size from the image metadata first; Bio-Formats usually brings it across when you open the file. If it is missing, draw a line along a scale bar or a calibration slide of known length, then enter that length under Analyze, Set Scale. Record the value you used next to your results, since every area and distance depends on it.
Getting help
The image.sc forum is the main public help desk for ImageJ, Fiji, QuPath, CellProfiler and napari, and the developers of those tools answer questions there. Include your software version, a sample image and the exact steps you tried; that is usually enough for someone to reproduce the problem.
For a guided introduction, use training materials. For Australian electron-microscopy resources, follow the EM data-processing portal notes. Those links describe the providers’ material; availability and access decisions belong to the provider.